
|
|
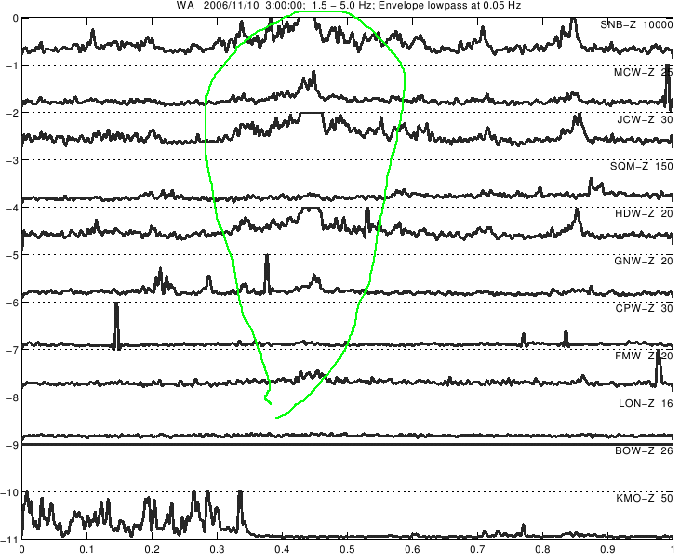
This plot shows an example of such an hourly envelope plot with a period of
tremor from far northern Washington outlined by the green line.
Note that at this time the traces for several
stations rise and fall in roughly the same pattern indicating that seismic
signals on those station changed amplitude in the same way, most likely due
to a common seismic source; ie tremor.
A different version of this sort of plot is being automatically produced using
a different averaging and smoothing proceedure on a subset of stations. Such
RMS or RSAM plots are updated about once an hour
and are about two hours behind realtime.
Such plots are reviewed by hand about once a day
and a tabulation of how much of each hour shows tremor is kept with an indication
of the general region in which it occurs.
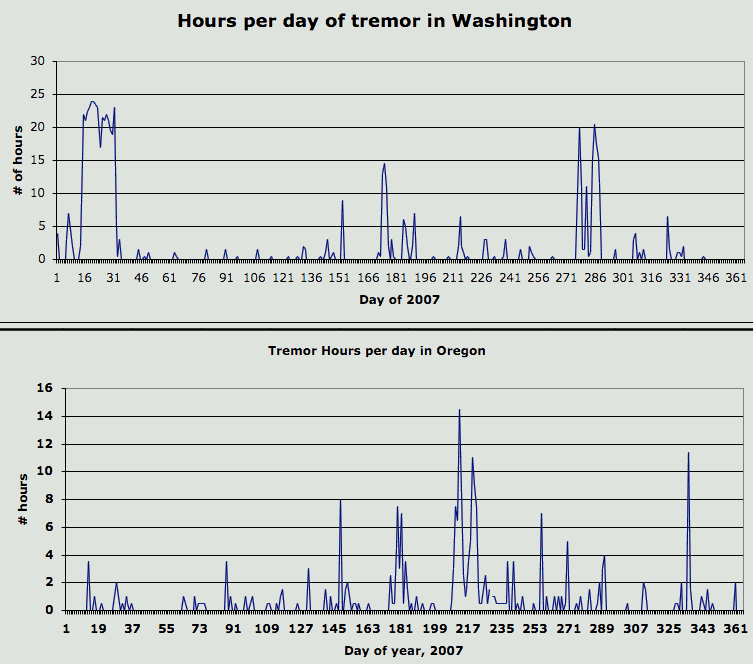
This is a plot of the number of hours for which tremor was tabulated using the
technique mentioned above for the year 2007. While the regions are kept track
of in more detail than indicated here they are separated into only Washington
and Oregon in these plots.
We are working on ways to farther automate this process and include crude tremor
locations rather than just hour summaries.
A semi-automated system has been developed to track the general occurence of
when and where deep tremor takes place within the PNSN region. This covers from
northern Puget Sound to southern Oregon. However, because of less complete station
coverage in parts of Oregon we feel that our tremor catalog for this area is
less complete. The technique we use is to select a few dozen station from the more
than 200 operated by the PNSN and save continuous waveform files in
hourly segments. The stations selected are those known to be sensitive to
deep tremor from past experience and are usually ones from a strip inland from the
coast, over the tremor source area and those at particularly remote and
quiet locations. Some stations from along the west flank of the Cascade mountains are
used because are particularly quiet. These waveforms are filtered in the pass band
of 1-6Hz, rectified, smoothed and the plotted in hourly plots.

