|
|
PNSN | Winter 2008 Tremor Episode | Fall 2006 Tremor Episode | Summer 2005 deep tremor |
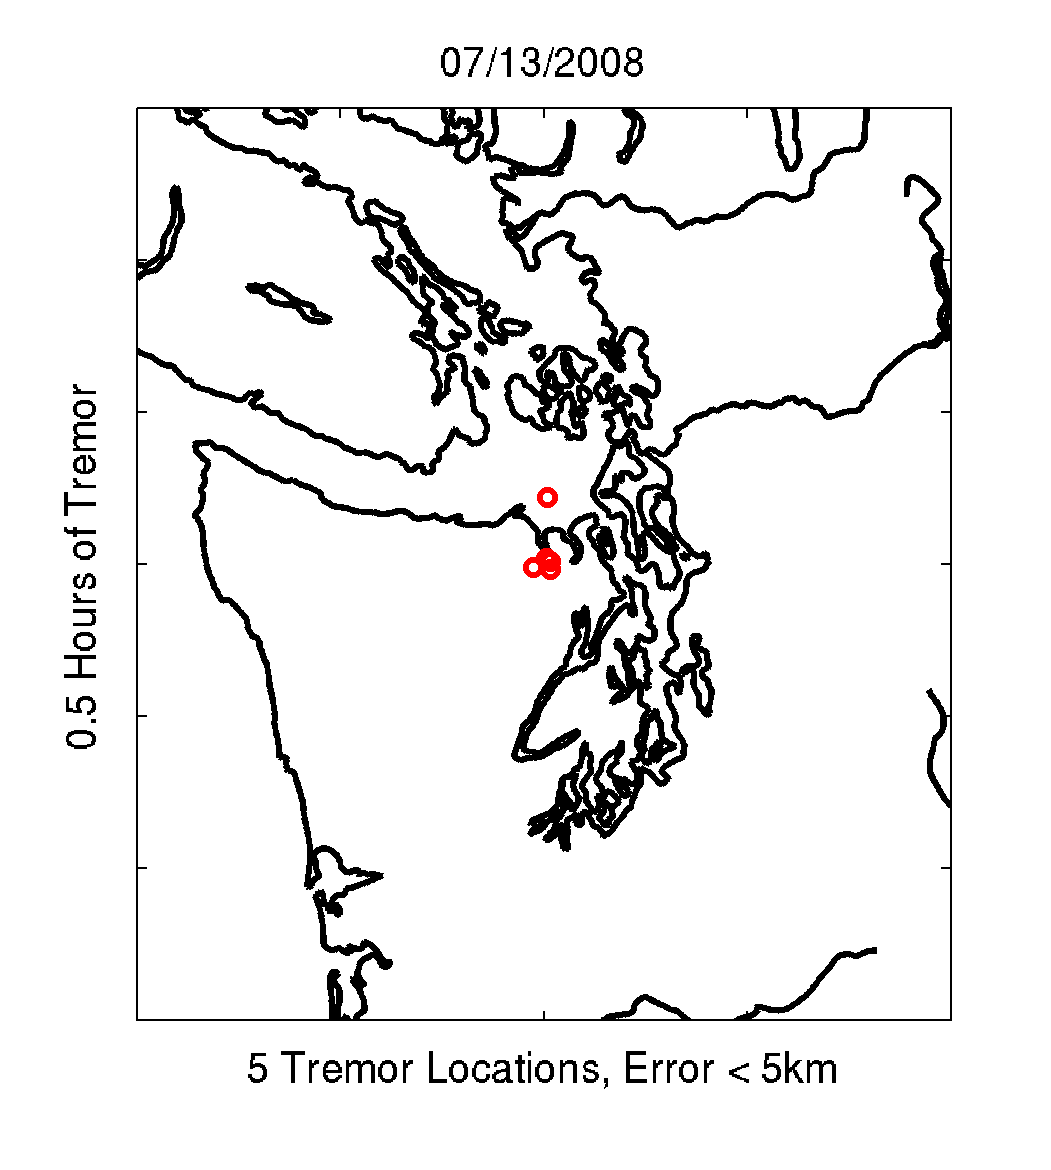
Tremor epicenters are automatically generated for every 5 minutes of the previous day
and ploted on a map of north-west Washington. This experimental, automatic
procedure is being developed by Aaron Wech and was changed on April 27, 2008
to give a different output.
It produces a location for every 5 minute time period using an envelope
cross-correlation tecnique to determine relative timing and then a
regular location program using S-wave velocities to invert for a location.
A boot-strap method is used to try and determine reliability of locations.
If a location passes this error check it will be ploted only
if at least 10 minutes (2 locations) of tremor
locates in the same 0.1 x 0.1 degree area. Thus each red circle on the plot
is the epicenter for a 5 minute tremor location in which at least one other
location is within 0.1 degrees. Areas where
there are larger concentrations of points are areas where longer tremor
has occurred. The previous plotting techique of contouring the number
of tremor locations within an area has been depricated.
Previous days automatic locations
Directory of archived locations
contain plots for previous days.
The location position maps have been turned into a short
animated movie
Use these locations with caution, particularly north of the Straights of Juan
de Fuca where stations available to the PNSN are limitted and biases due to
station distribution is unknown.