|
|
PNSN | Fall 2006 Tremor Episode | Summer 2005 deep tremor |
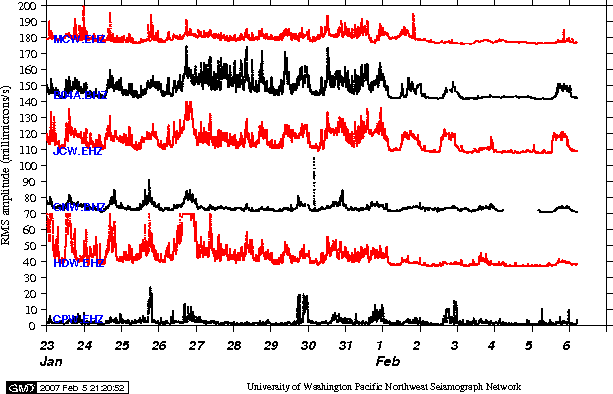
Average (root-mean-square) signal amplitudes (or "RSAM") of vertical ground velocity recorded at selected stations
of the Pacific Northwest Seismograph Network. The stations are (top to bottom on the graphs, ie north to south)
MCW, STW, JCW, GNW, HDW, CPW
Smoothed RSAM data for three day period of strongest tremor for
selected stations shows periods of deep tremor.
Episodic tremor shows up as an increase in signal that appears simultaneously on several stations.
Signals are converted to
true ground velocity in millimicrons per second before the rms
is computed. The data are filtered between 1.5 and 5 Hz before the
average (rms) amplitude(over a 60 sec window) is computed. The average amplitude is
de-glitched and then further smoothed (running average) over a time window of 20 minutes
RMS amplitude will also reflect any earthquakes
that occur, changes in cultural noise, and other artifacts.
Note the daily cycle on some stations, probably due to higher cultural noise
(trucks, trains, human activity) during the day.
Two weeks for the last part of this ETS RSAM data
Average (rms) amplitudes are displayed as a function of time. Each dot on the graph is the average amplitude computed for a 60 sec window.
ETS tremor was considered over on Feb 2, 2007. Regular daily pulses,
particularly on JCW are due to cultrual/telemetry noise.


Map of stations in above plots.