Tremor density by ETS

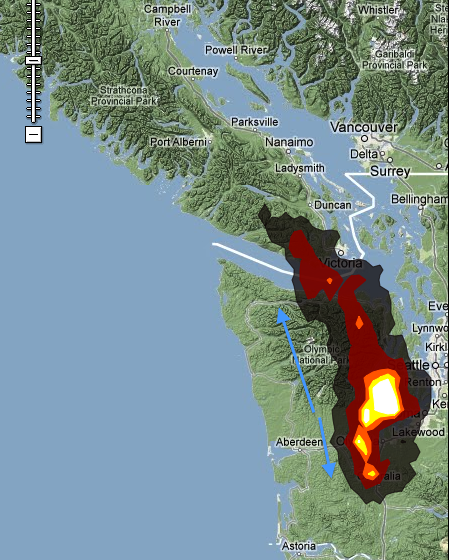
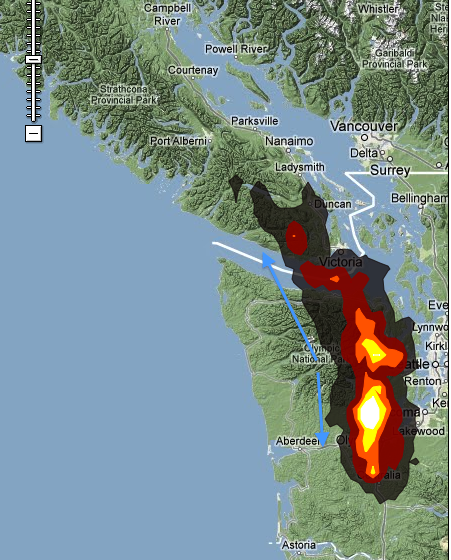
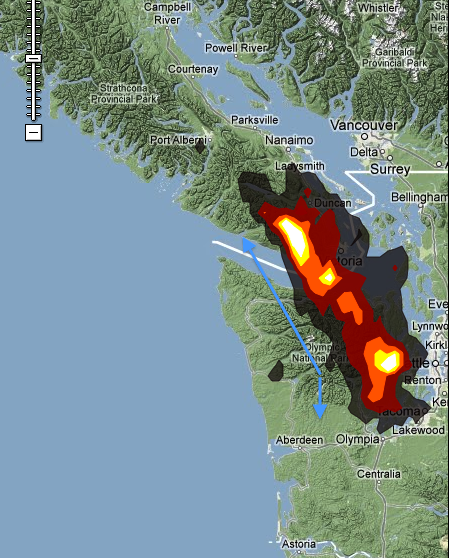
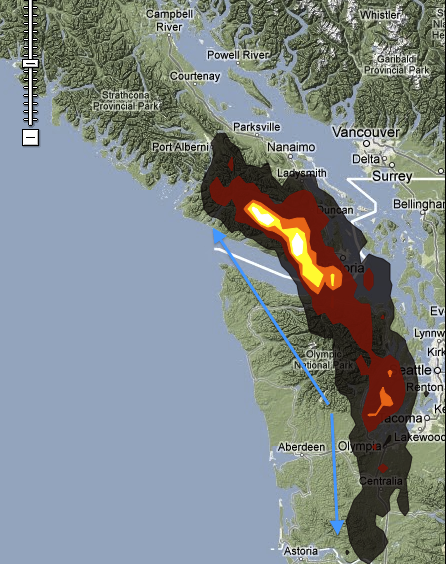
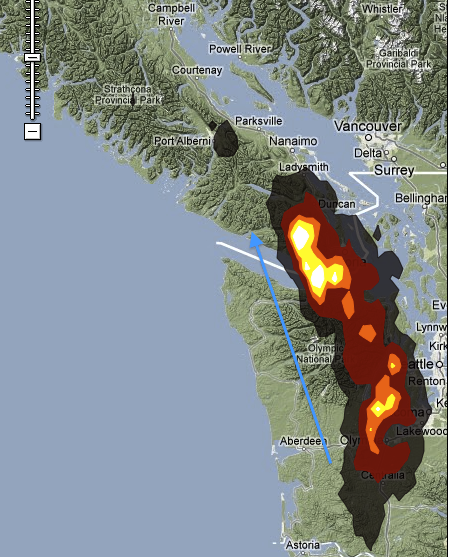
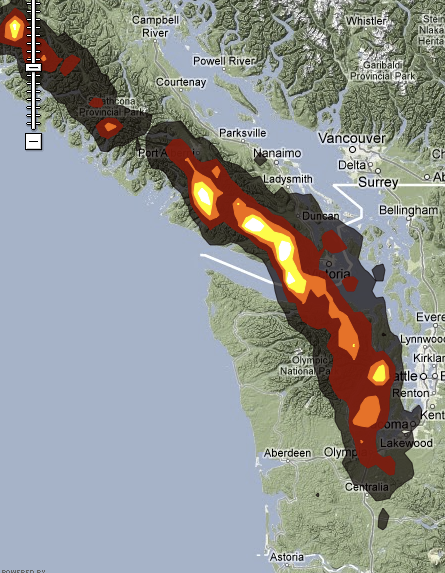
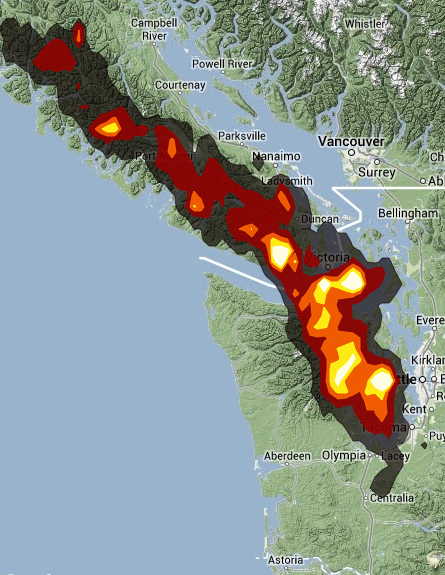
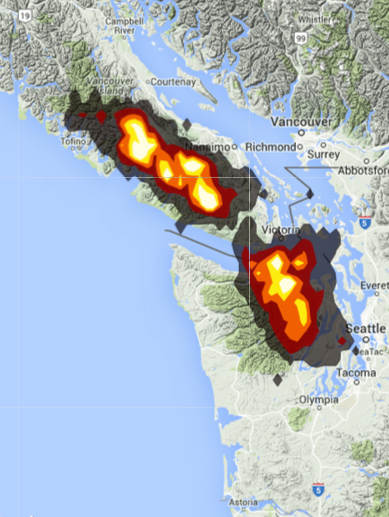
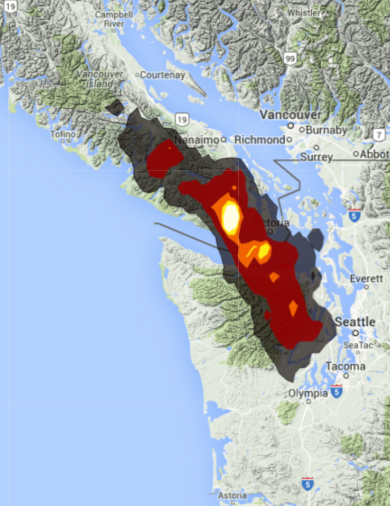
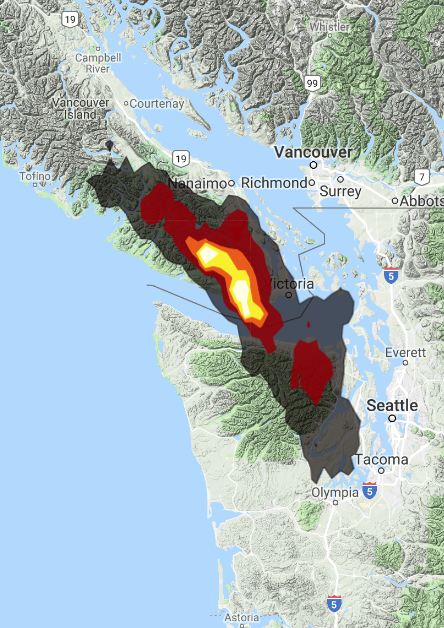
Plotted at the same scale are the last seven northern Washington-southern Vancouver Island ETS events. These density plots are done by contouring the number of tremor locations at each grid point during the whole ETS. The blue arrows indicate the directions of propagation of the tremor over the whole ETS if it is clear.
Back to weekly tremor location comparisons.

WARNING: The density amplitude may be missleading because of double counting due to the same tremor location being reported by two different subnets.
-- Winter 2007 --
Jan 12 - Feb 2 (21 days)
-- Spring 2008 --
Apr 30 - Jun 2 (34 days)
-- Spring 2009 --
Apr 28 - Jun 3 (37 days)

-- Summer 2010 --
Aug 8 - Sep 8 (32days)
777 hours of tremor and 14,130 locations
-- Summer 2011 --
July 23 - Sep 4 (43 days)
694 hours of tremor and 12,084 locations
-- Fall 2012 --
Aug 30 - Oct 11 (42 days)
1,068 hours of tremor and 19,140 locations

-- Fall 2013 --
Sep 7 - Oct 7 (31 days)
654 hours of tremor and 11,080 locations
-- Fall 2014 --
Nov 5 - Dec 10 (35 days)
430 hours of tremor and 7,662 locations
-- Winter 2015 - 2016 --
Dec 22 - Jan 16 (26 days)
523 hours of tremor and 9,103 locations

-- Winter 2017 --
Feb 18 - Apr 6 (35 days)(pause of 2 weeks)
568 hours of tremor and 10,086 locations
-- Spring 2018 --
May 9 - Jul 15 (66 days) (pause of 36 days )
824 hours of tremor and 30,028 locations