Mount Rainier Swarm Report
Largest Event: Magnitude 2.3,
NE of Mt Rainier, WA
Sunday September 20, 2009 at 09:45:27.80 AM (PDT)
|
Magnitude |
2.3 |
|
Time
| Sunday September 20, 2009 at 16:45:27.80 Z (UTC)
Sunday September 20, 2009 at 09:45:27.80 AM (PDT) |
Distance from |
1.1 km NE of Mt Rainier, WA
39.4 km E of Eatonville, WA
93.8 km SSE of Seattle, WA (1st & Yesler)
|
|
Coordinates |
46.859 deg N
121.749 deg W |
|---|
|
Depth | 3 km |
|
Quality | excellent (AA) |
| Note: 1 km = 0.621 mile or 1 mile = 1.61 km |
|
|
Executive Summary: A swarm of small earthquakes started on the morning of September 20, 2009, at about 09:00 PDT beneath Mount Rainier. To date, the swarm has consisted of hundreds of earthquakes, most occurring on Sept. 20. Most locate at a depth of 2-3 km (1-2 miles) beneath the northeast flank of the volcanic edifice, centered ~1 km (0.5 miles) northeast of the summit. The largest event was a M 2.3 on Sept. 20. As of Sept. 23 swarm events continue, but at a greatly reduced rate since early on September 22. Seismic swarms are concentrations of earthquakes that typically are not initiated with a mainshock, and are common features at volcanoes. The vast majority of volcanic swarms are not associated with eruptive activity. Rainier itself has had several such swarms: in the past 7 years there have been similar days-long swarms in 2002, 2004, and 2007, two of which
(2002 and 2004 )included M 3.2 earthquakes. The Sept. 20 swarm has produced the largest number of events of any swarm at Rainier since seismic monitoring began over two decades ago, so we will continue to closely monitor seismicity and other geophysical parameters at Rainier.
View Seismograms
- View web-based seismograms by station and date.
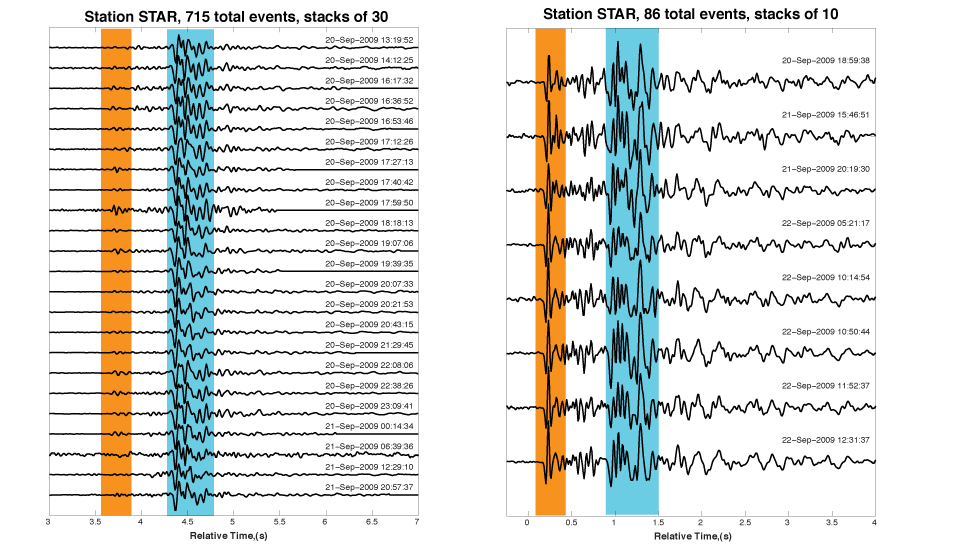
Example Waveforms
- Many of the earthquakes within this swarm consisted of repeating earthquakes. Repeating earthquakes are common within swarms. Two of the most prominent repeating earthquake sequences are shown in the figure here. Each seismogram in this figure is actually a stack, or average, of many events. Small changes in the stacks are caused by small changes in the location or mechanism of the earthquakes. The orange boxes shows the p-wave arrival and the blue boxes show the s-wave arrival. The dates shown on the plot reflect the time of the first earthquake in the stack. The first repeating earthquake sequence, consisting of 715 events, was dominant during the beginning of the swarm. The second repeating earthquake sequence, consisting of 86 events, was dominant during the later stages of the swarm.
Maps and History of Earthquakes in this Region
- A map of the Pacific Northwest showing the location of the swarm (in red) plus prior earthquakes M > 3.0. Shallow events are black. Events deeper than 35 km are green.
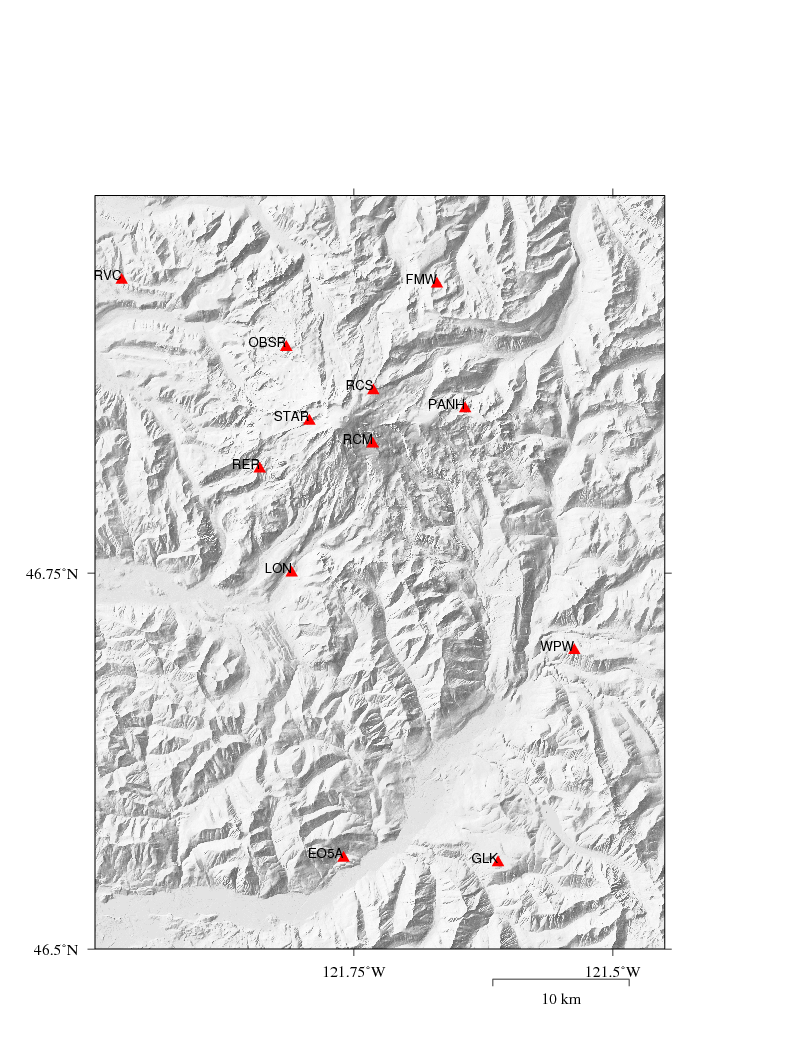
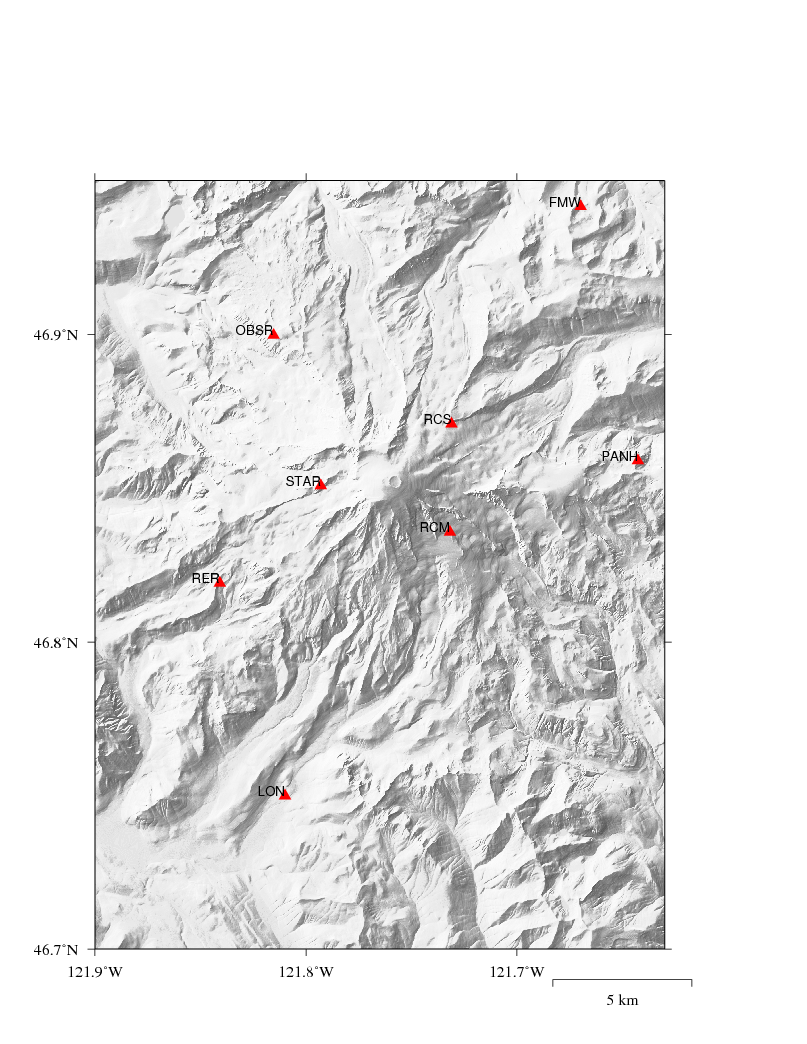
- A regional map showing the location of the seismometers around the Mount Rainier.
- A volcano map showing the location of seismometers on Mount Rainier.
- A detailed list of all earthquakes (M > 1.0) that occurred in the two years prior to the mainshock in the same area.
- Plots of earthquakes occuring the last decade including plots of time vs. depth, map view and cross-section.
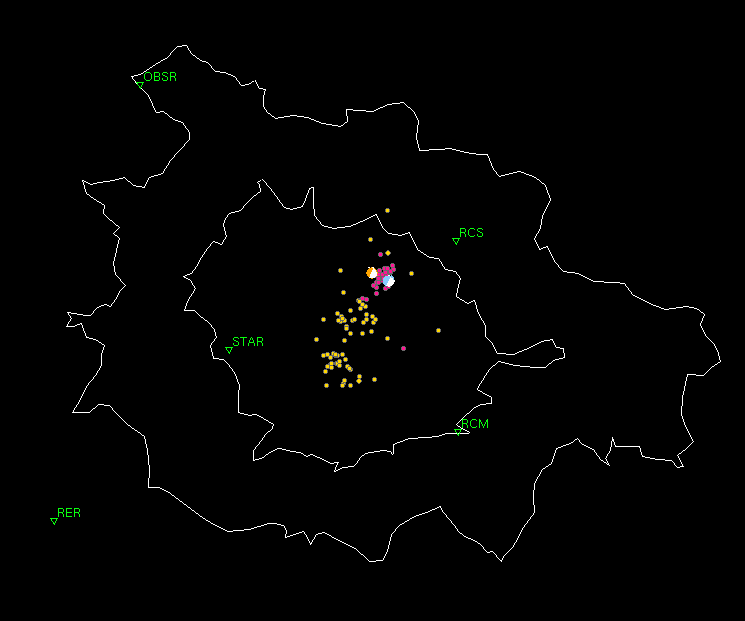
- Relocated earthquakes Map View (2003-2009) Shown here is a map view of earthquake locations using a 3-dimensional velocity model instead of the standard 1-dimensional velocity model. Yellow circles are earthquakes between 2003 and Sept. 19, 2009. Pink circles are earthquakes that are part of this swarm (Sept. 20-Sept.22, 2009). White lines are elevation contours and green triangles are seismic stations. Relocations from Seth Moran, Cascade Volcano Observatory.
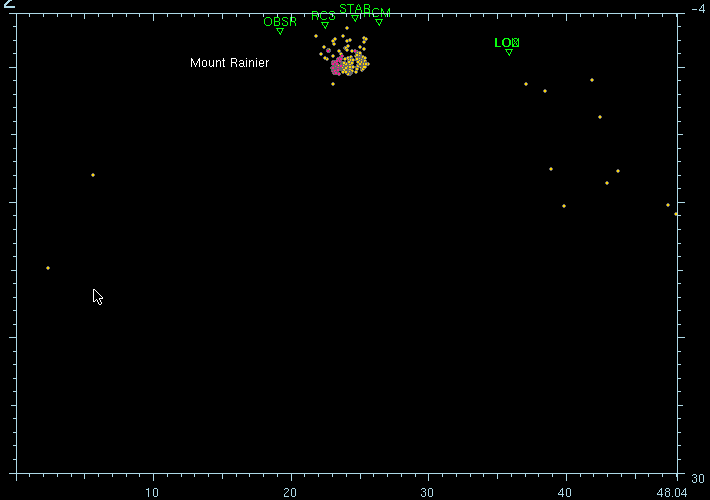
- Relocated earthquakes Cross Section (2003-2009) Shown here is a cross-section looking east of earthquake locations using a 3-dimensional velocity model instead of the standard 1-dimensional velocity model. Yellow circles are earthquakes between 2003 and Sept. 19, 2009. Pink circles are earthquakes that are part of this swarm (Sept. 20-Sept.22, 2009). Green triangles are seismic stations. Units on the y-axis are kilometers below sea-level. Units on the x-axis are in kilometers from the left-hand axis. Relocations from Seth Moran, Cascade Volcano Observatory.
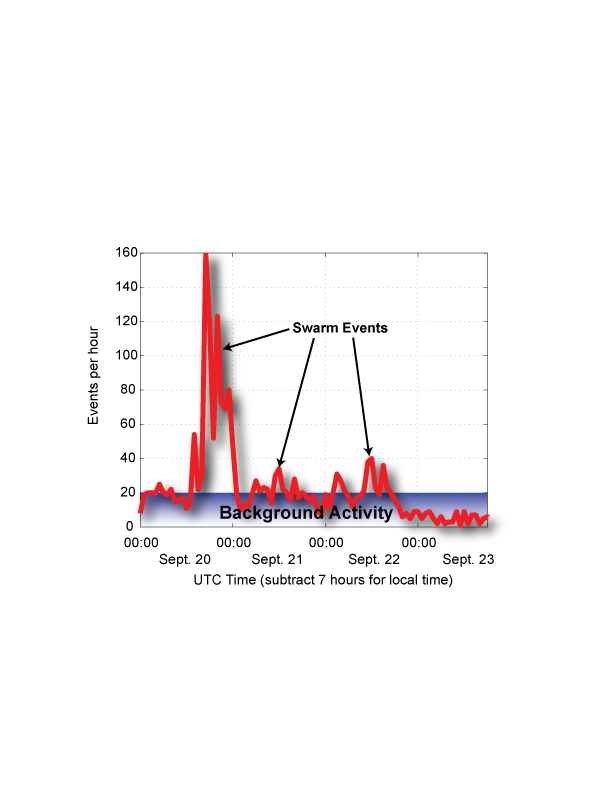
- A plot showing the event rate of the automatically determined earthquakes throughout the swarm. If an earthquake is detected on stations RCS, RCM and STAR, than an event is declared and counted on this plot. Most, if not all of the background activity consists of earthquakes associated with the movement of glaciers.(Updated periodically)
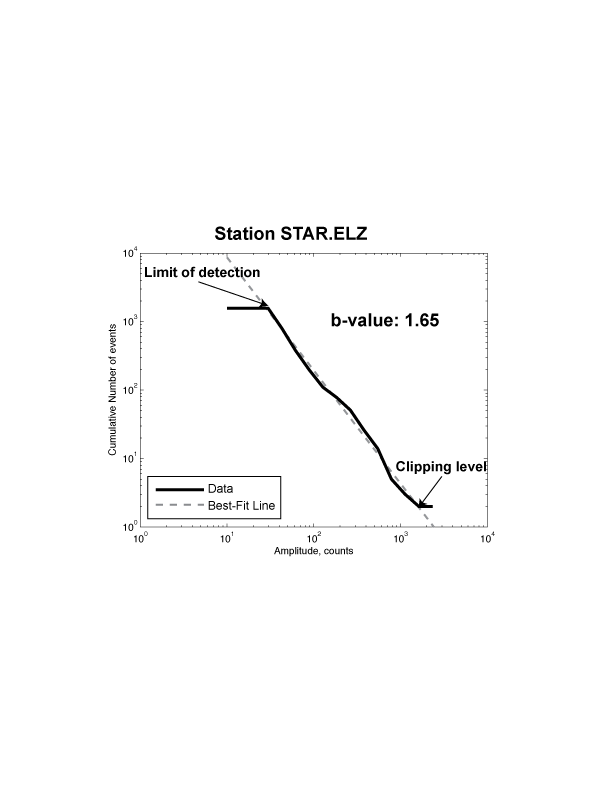
- A plot showing the b-value of the automatically determined earthquakes throughout the swarm. B value is a measure of the relative number of small earthquakes to large earthquakes. In a regular tectonic setting, each unit increase in the magnitude scale results in a 10-fold decrease in occurence. Tectonic seismicity usually has a b-value of 1, meaning that there are 10 times as many M1 earthquakes as M2 earthquakes, and 10 times as many M2 earthquakes as M3 earthquakes. Volcanic seismicity normally has a b-value in excess of 1.
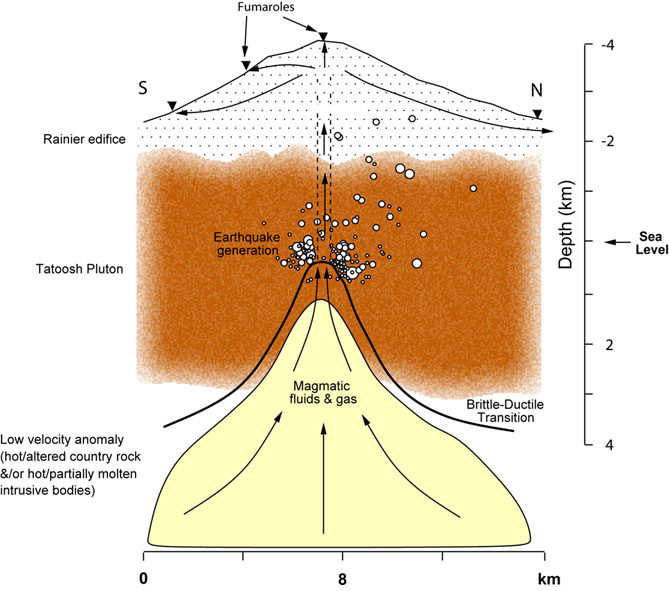
- Conceptual model of Mount Rainier. This plot shows shows our interpretation of the seismicity under Mount Rainier. Circles represent earthquakes and arrows represent the paths of fluid flow. Most events, including those in this swarm have occurred at a depth near sea level. Hydrothermal fluids circulating above a zone of partially melted rock are most likely the cause of the seismicity near this depth. Figure from Seth Moran, Cascade Volcano Observatory.
Automatically updated plots -
The following information will be updated as new events occur.
Included are:
Focal Mechanism - A diagram and table of the P-wave fault plane solution. If sufficient P-wave first motion data are available, a fault plane determination for the earthquake will be available.
An alternative set of plots and information can be found at the
PNSN Mount Rainier Volcano
Pages
Related Information - Most Up-to-Date Local and Global Earthquake Summaries