Information contained in this report is preliminary,
and should not be cited for publication. The on-line version of the quarterly isabbreviated. The complete quarterly is available in paper version on request.
Seismograph network operation in Washington and Oregon is supported by the state of Washington and the following contracts: U.S. Geological Survey Joint Operating Agreement 01-HQ-AG-0011 and Contract 259116-A-B3 from the Pacific Northwest National Laboratory, operated by Battelle for the U.S. Dept. of Energy
There were 1,520 events digitally recorded and processed at the University of Washington between April 1 and June 30, 2002. Locations in Washington, Oregon, or southernmost British Columbia were determined for 851 of these events; 731 were classified as earthquakes and 120 as known or suspected blasts. The remaining 669 processed events include teleseisms (144 events), regional events outside the PNSN (94), and unlocated events within the PNSN. Unlocated events within the PNSN include very small earthquakes and blasts. Frequent mining blasts occur near Centralia, Washington and we routinely locate them.
Table 3A is a listing of all earthquakes reported to have been felt during
this quarter, events for which
ShakeMaps or Community Internet Intensity Maps (CIIM) are noted.
ShakeMap shows instrumentally measured shaking.
CIIM maps are made using "felt" reports relayed via Internet. These "felt" reports are converted into numeric intensity values, and the CIIM map shows the average intensity by zip code.
TABLE 3A: EARTHQUAKES REPORTED FELT, 2nd QUARTER, 2002
    DATE-(UTC)-TIME	LAT(N)	LON(W)	DEPTH	MAG	COMMENTS			CIIM	 SHAKEMAP
  yy/mm/dd hh:mm:ss   deg.   deg.    km

02/04/13 07:18:55   47.67   117.43     1.3   -0.2      1.6 km WNW of Spokane, WA
02/04/14 15:20:46   47.69   117.39     2.5   -0.9      3.1 km NNE of Spokane, WA
02/04/21 06:21:18   47.68   117.42     0.3   -0.4      1.8 km  NW of Spokane, WA
02/04/22 10:38:51   47.29   122.29    20.6    2.2     12.1 km ENE of Tacoma, WA
02/05/01 09:09:45   48.45   119.54     3.7    2.9     10.6 km NNE of Okanogan, WA
02/05/15 17:54:48   42.23   121.90     8.1    4.3     10.0 km   W of Klamath Falls, OR

02/05/30 01:40:16   48.87   122.20    13.8    1.6      5.9 km NNE of Deming, WA
02/06/06 14:42:46   47.72   120.28     7.2    3.4      8.1 km  NW of Entiat, WA
02/06/16 17:11:10   47.47   122.82    16.1    3.7     18.2 km  SW of Bremerton, WA  	 x	   x
02/06/29 14:36:04   45.33   121.68     6.2    4.5      4.5 km   S of Mt Hood, OR    	 x
02/06/29 14:41:21   45.32   121.68     2.7    3.2      5.4 km SSE of Mt Hood, OR
02/06/29 18:49:58   45.34   121.67     6.1    3.8      3.9 km SSE of Mt Hood, OR   	 x
During the second quarter of 2002, a total of 190 earthquakes were located in Oregon
between 42.0° and 45.5° north latitude, and between
117° and 125° west longitude.
The largest earthquake in Oregon this quarter was a magnitude 4.5 earthquake
on June 19 located at a depth of approx. 6 km, about 4.5 km south of Mt. Hood volcano. See the special section below on recent Mount Hood seismicity.
In the Klamath Falls area 39 earthquakes, including the largest shock in the Klamath Falls area since January of 1994, were located this quarter. On May 15, a magnitude 4.3 event was located 10 km west of Klamath Falls at about 8 km depth. Nine smaller shocks, two magnitude 2.0 or larger, were located in the following 48 hours. Since 1994, most earthquakes in the Klamath Falls area have occurred in the aftershock zone of a pair of damaging earthquakes in September, 1993. The 1993 earthquakes were followed by a vigorous aftershock sequence which decreased over time.
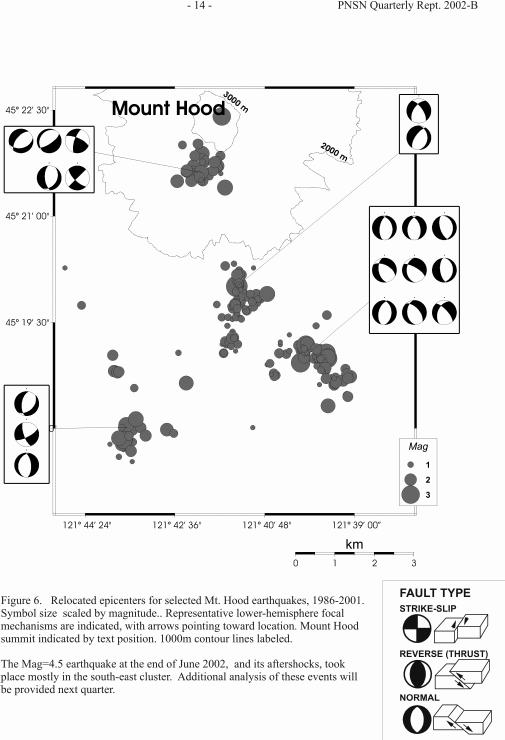
Mount Hood, Oregon:
This quarter 145 earthquakes were located in the area around Mount Hood from 45.25 to 45.45 N latitude and 121.6 to 121.8 W longitude. Eighty-nine of the events occurred in the last two days of the quarter, June 29-30, when an unusual sequence included one foreshock (magnitude 1.1), a magnitude 4.5 main shock, and a vigorous aftershock sequence that continued into July. The June 29 UTC main shock was the largest earthquake near Mount Hood since at least the installation of the instrumental network (1981).
The 54 earthquakes earlier in the quarter, prior to June 29, included 15 events (two larger than 2.5) on May 6 UTC, 14 events on May 23-24 UTC (none larger than 2.0), 5 events on June 3 UTC (magnitudes 1.2 to 1.5) and 7 events on June 12 ( only one event larger than magnitude 1.0).
Following the magnitude 4.5 main shock of June 29, J. Jones, R. Norris, and E. Barnett installed a temporary CMG-40T broadband seismograph near Mt. Hood Meadows ski resort. Acquisition began at approximately 7:30 AM, June 30 UTC. This temporary station is currently the closest instrument to most of the aftershock epicenters. Plans are underway to locate a permanent s tation at Mt. Hood Meadows.
Earthquake activity near Mt. Hood from 1986 through September 2001 was the subject of a poster presented at the April, 2002 meeting of the Seismological Society of America. In order to place better constraints on the cause of Mt. Hood's periodic earthquake swarms, J. Jones and S. Malone applied waveform cross-correlation to the seismograms of 241 well-constrained earthquakes near Mt. Hood, recorded by the PNSN between January 1986 and September 2001. Jones and Malone used the Xadjust waveform cross-correlation program (D odge et al. 1995) to determine high precision relative phase arrival times. After traces were adjusted, arrival times of the 46 highest-quality events were used to determine a minimum 1-d velocity model and station corrections, using the Velest earthquake location program of Kissling et al. (1994). The full set of adjusted picks for all 241 events was then relocated using Velest. Spatial resolution is currently being further refined using the HypoDD double-difference earthquake location program of Waldhauser and Ellsworth (2001).
After relocation, the initially diffuse cluster of seismicity appears to fall into four distinct groups (Figure 6): a cluster located directly beneath the summit; a well-defined linear feature trending N-S, located about 5 km south of the summit; a well-defined linear feature trending NW-SE, located a few km SE of the second cluster; and a tight cluster of earthquakes located about 8 km SW of the summit. These features are not obvious from catalog locations alone, though using Velest with routine analyst picks is able to resolve them to a limited degree. First-motion fault plane solutions from some of the larger events have normal faulting mechanisms, in contrast to the thrust mechanisms found throughout the northwest. Because of the proximity of these events to the volcano, their swarm-like characteristics and their normal faulting mechanisms, it is possible that these events are related to volcanic processes below the mountain; however, because of their depth, fault-like alignments and main-shock/after-shock nature of the latest sequence it is equally likely that they are related to tectonic faults near the mountain. Further analysis is underway.
During the second quarter of 2002, 485 earthquakes were located between 45.5° and 49.5° north latitude and between 121° and 125.3° west longitude. Three earthquakes were felt this quarter in western Washington. Details are in Table 3A.
The largest felt earthquake in western Washington was a magnitude 3.7 earthquake about 18 km southwest of Bremerton. It located at a depth of about 16 km. The deepest quake in western Washington was a magnitude 0.6 earthquake at about 71 km, located about 13.2 km southwest of Concrete, WA.
Swift Reservoir Canal Breach, April 21st.
The Swift Reservoir Power Canal near Mount St. Helens collapsed early on Sund ay, April 21st, with almost 800 million gallons of water spilling out in a fe w hours. A hydroelectric powerhouse was destroyed and part of a state highway was washed out. In conjuction with the collapse, the PNSN recorded a series of seismic signals starting at about 06:30:33 PDT Apr. 21. Several bursts of energy occurred in the ten to fifteen minutes following 06:30 superimposed on an increase in seismic background levels. These background signals started slowly decaying after about 06:45 and had returned completely to normal background levels by about 07:15 PDT. At 06:56:49 an impulsive seismic event occurred which was strong enough on several PNSN stations to trigger an automatic earthquake locator. With careful manual analysis of this last event it was located near the head of Yale Reservoir at very shallow depth. This is near the site of the failure and power plant. The size of this last event has an equivalent earthquake duration magnitude of 1.6. Since this event is not an earthquake and occurs at the earth's surface this duration magnitude over-estimates the energy release. We estimate an amplitude magnitude for this event of 0.9 (equivalent seismic energy of 8x10**12 ergs). The frequency distribution of the final event is somewhat different from those preceeding it.
Based on waterlevel reports provided by the Cascade Volcano Observatory and eyewitness accounts we feel that the seismic signals are consistent with the following interpretation. The short transient signals are most likely related to the failure of the walls of the canal and the increased background levels are associated with the turbulent flood of water thus released.
Provisional data from water-level recorders operated by US Geological Survey for the Cowlitz County Public Utility District show that the water level in the canal started to decline slowly as early as 03:00 PDT. At about 06:00 PDT the drop in level accelerated and by 06:45 PDT the water had dropped below the bottom of the gage (about 12 ft below normal level). An eyewitness reported the sudden failure of the canal embankment and outflow of remaining water shortly before 07:00 PDT. This final failure occurred after more than 12 ft of water had leaked out.
The seismic signals would indicate that canal integrity started failing around 06:30 PDT. It may have been progressive over the next 10-15 minutes and included quite a bit of water. The event at 06:56 has a somewhat different character than the previous signals. It is much richer in high frequency and very impulsive. It has the characteristics of an impact or small explosion. If the final failure of the canal wall was very sudden causing a drop of a large amount of material onto a surface (not a sliding away) this would be the consistent with this signal. The released energy causing the seismic event took place over only a few seconds. It's possible that this last event was initiated by accelerating seepage through the floor of the canal and the embankment. Small slumps of material caused some sort of void, into which a large part of the embankment fell.
Additional information is available at:
The number of events in close proximity to the cone of Mt. Rainier
varies over the course of the year, since the source of much of the
shallow activity is presumably ice movement or
avalanching at the surface, which is seasonal in nature.
Events with very low frequency signals (1-3 Hz)
believed to be icequakes are assigned type "L" in the catalog.
Emergent, very long duration signals, probably due to rockfalls or
avalanches, are assigned type "S" (see Key to Earthquake Catalog).
There was one located event flagged "L" at Mount Rainier this quarter although 23 "L" or "S" events were recorded, but were too small to locate reliably.
Type L and S events are not shown in Fig. 4.
.PP
A total of 60 tectonic events (28 of these were smaller than magnitude 0.0, and thus are
not shown in Fig. 4) were located within the region shown in Fig. 4.
The largest tectonic earthquake located near Mt. Rainier this quarter was a magnitude 2.4 earthquake on May 27 at 19:33 UTC, located about
18 km west-northwest of the summit at about 13 km depth. This quarter, 34 of the tectonic earthquakes were located in the "Western Rainier Seismic Zone" (WRSZ), a north-south trending lineation of seismicity approximately 15 km west of the summit of Mt. Rainier (for counting purposes, the western zone is defined as 46.6-47 degrees north latitude and 121.83-122 west longitude).
Within 5 km of the summit, there were 20 (13 of them smaller than magnitude 0.0 and thus not shown in Fig. 4) higher-frequency tectonic-style earthquakes, and
the remaining events were scattered around the cone of Rainier as seen in
Fig. 4.
This quarter, 200 earthquakes were located at Mount St. Helens in the area shown in Fig. 5. Of these earthquakes, 36 were magnitude 0.0 or larger and 53 were deeper than 4 km. The largest tectonic earthquake at Mount St. Helens this quarter was a magnitude 1.9 event at about 2 km depth on May 22 UTC. It was located .7 km NE of the dome. .PP One type "S" event was located at Mount St. Helens, and 107 "L" or "S" events too small to locate were recorded.
During the second quarter of 2002, 55 earthquakes were located in eastern Washington in the area between 45.5-49.5 degrees north latitude and 117-121 degrees west longitude. Activity in the Spokane area, discussed at length in the 2001-C and 2001-D quarterlies, continued at a very low level in the second quarter of 2002. Three very small quakes (magnitudes between -0.2 and -0.9), were felt, and a fourth tiny quake, magnitude -0.8 was not reported felt. The largest earthquake in eastern Washington this quarter was magnitude 3.4. It had a depth of about 7 km, and was located 8 km northwest of Entiat. Entiat is an area with a long-lasting spatial cluster of activity. A quake of approximately 5.0 occurred there in 1959, and the 1872 (magnitude estimated at 6.8-7.4) North Cascades earthquake may have originated in this area.